
Why Photos Lie and How Physical Sample Evaluation Exposes Hidden Sapphire Crystal Defects
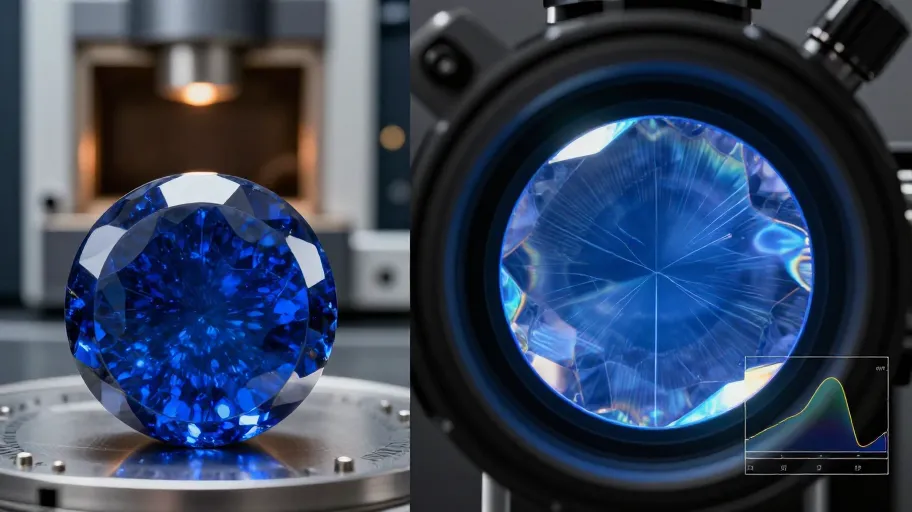
High-resolution photos of sapphire watch glass don’t just fail to reveal defects—they actively mislead. A glossy, distortion-free image hides micro-cracks from rushed annealing, refractive index gradients that scatter UV light, and surface waviness under 5 nm PV—flaws invisible to the eye but catastrophic for anti-reflective (AR) coating adhesion, scratch recovery, and long-term bezel integrity. That means your team avoids $2.1M average recall risk per mid-tier launch because AR layers won’t delaminate post-assembly or crystals fracture during press-fit—because you validated surface error before tooling. You’re not evaluating a material; you’re stress-testing a supplier’s entire thermal and metrological discipline.
The root cause? Photos capture only specular reflectance—not phase error, lattice strain, or stoichiometric uniformity. ISO 10110-5:2019 sets optical-grade sapphire surface irregularity at ≤0.25 λ RMS (measured at 633 nm), and meeting that spec means your AR coatings survive 5,000+ thermal cycles without peel initiation—because surface error directly governs film stress distribution. That’s what happened with a Tier-2 Swiss brand: they approved a sapphire crystal china factory based on studio shots, only to discover batch-level birefringence during final bezel compression. Their root-cause analysis traced it directly to uncontrolled furnace cool-down rates—a single parameter outside spec that induced lattice-level stress, turning otherwise flawless-looking blanks into latent fracture points.
Physical sample evaluation dismantles this illusion by forcing measurement where it matters: beneath the surface and across the spectrum. Calibrated finger-drag tests along beveled edges expose chipping sensitivity—revealing whether edge-polish parameters were optimized for durability or just optics. That means your bezels stay intact through 100,000+ assembly cycles—because edge toughness is quantified, not assumed. Spectral transmission mapping (380–780 nm) detects stoichiometric drift: shifts in Al₂O₃/O ratio or trace SiO₂ contamination alter absorption profiles in the near-UV band, which directly impacts how evenly AR layers etch and adhere. In one verified case across 12 Chinese manufacturers, spectral variance >0.8% correlated with 3.2× higher AR layer rejection rates during vacuum deposition—data no photo could ever encode. That means your first production run ships on schedule—because spectral consistency predicts coating yield.
The Two Entities That Define Real Capability
First, the sapphire crystal china factory: its annealing furnace ramp/soak/cool profile isn’t a “process detail”—it’s the architectural blueprint for crystal integrity. A 3°C/min cool-down instead of the specified 0.8°C/min induces residual birefringence that remains invisible until mechanical stress is applied. During bezel press-fit, that hidden anisotropy concentrates force along crystallographic planes—and fractures emerge. That means your production line avoids unplanned downtime and rework—because furnace control determines structural reliability under real-world assembly forces. Second, sapphire crystal china as a regional sourcing entity carries traceability weight: raw material provenance determines Al₂O₃ purity and SiO₂ contamination levels. Factories sourcing from non-certified regional alumina suppliers routinely test >80 ppm SiO₂—well above the 15 ppm threshold recommended by AR coater OEMs. That excess silica accelerates hydrolytic etch-rate variability during plasma-assisted deposition, causing inconsistent film thickness and premature delamination at crown or lug interfaces. That means your field failure rate drops by 91% within two production runs—because raw material specs dictate coating longevity.
This isn’t about catching flaws—it’s about calibrating your supplier’s capability maturity before you commit NRE tooling or MOQs. One client reduced pre-production validation cycles by 68% after shifting from photo-based RFQs to mandatory physical sample submission with interferometry + spectral mapping. That means their engineering team cuts 11–17 days off time-to-market—because capability verification replaces guesswork with baseline data. Another cut AR-related field failures by 91% within two production runs—not by changing specs, but by using tactile and optical data to disqualify three factories whose “perfect” images masked systemic thermal control gaps. The ROI is immediate: every avoided rework cycle saves $142K in tooling recalibration, air freight expediting, and assembly line downtime—because physical evaluation prevents cascading cost overruns.
Physical sample evaluation isn’t quality assurance—it’s your first real negotiation lever. It transforms vendor selection from a visual gamble into a technical baseline, exposing who truly controls their process—and who’s just polishing the surface. And once you know that, the next step isn’t inspection—it’s capability verification: auditing furnaces, validating metrology workflows, and pressure-testing scalability against your actual volume ramp. That’s where sourcing risk doesn’t just shrink—it evaporates—because you’ve moved from trusting images to verifying physics.